
Impact of Inflation on Valuation – from a valuer’s perspective
Over the past year, inflation has approached multi-decade highs in many countries prompting central banks across the world to adopt aggressive rate-hike regimes in order to keep up with ongoing inflationary pressures. Factors such as a tight labour market, strong consumer sentiment and pent-up demand built up during the pandemic will continue to drive inflation to remain sticky in the longer run.
Understanding inflation’s impact on valuation is synonymous with its effect on the underlying value drivers of a company’s value. In this case, inflation’s impact on a company’s intrinsic value that is calculated using the Discounted Cashflow (“DCF”) approach can be split by its effects on the company’s free cash flow – forecasting portion – and its effects on the required rate of return by investors – discount rates portion.
1. Effect on Discount Rate
1.1 Risk-Free Rate: As inflation rises globally, risk-free rates follow suit
In an effort to tame growing inflation, the Federal Reserve in the United States (“U.S.”) has taken very aggressive measures over the past 15 months through raising the federal funds target rate by 500 basis points since March 2022, with a commitment to bring inflation down to the 2% target, causing the tightening cycle to be the fastest observed in the last four decades. As a result, U.S. treasuries have risen across all maturities, with long-term rates (10-year and 30-year treasuries), which are normally used as a proxy for risk-free rates, more than doubled from their historic lows in 2020. (Refer to Exhibit 1)
Exhibit 1: Movement of U.S. Inflation and U.S. 10Y Treasury Bond Rate
U.S. Quarterly CPI YoY (%), U.S. 10Y Treasury Rate (%)
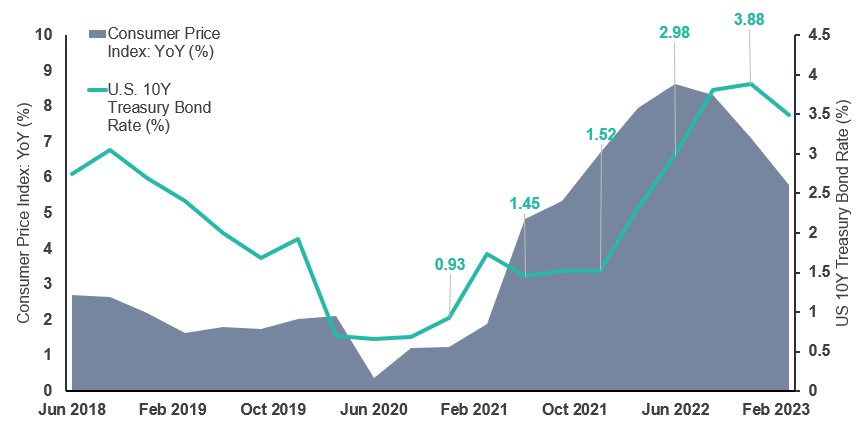
Note:
YoY refers to “Year-on-Year”. All data were extracted as at 23 May 2023.
Sources:
(1) United States Inflation data is based on quarterly YoY (%) data extracted from International Monetary Fund
(2) United States 10 Year treasury bond rate (%) is on a quarterly basis and is extracted from Statista
1.2 Cost of Debt: Widening credit spread potentially raises cost of debt
Cost of debt is the interest rate at which a company can currently borrow. From an investor’s perspective, it can also be defined as the required rate of return by bondholders, taking into account the company’s risk. Cost of debt can be broken down into its components: risk-free rate and the company’s default spread – which is determined by a company’s interest coverage ratio.
As treasury rates have risen, markets have also seemed to have been more wary about risk. Reflecting this in 2022, corporate default spreads have generally moved up during the year as the overall cost of borrowing has increased.
However, the magnitude of the increase in spreads is not equally felt across all corporates. Existing risky companies are bound to suffer the greatest from higher default spread expansion. These companies that have lower and less stable earnings or have borrowed heavily will have a higher default spread and subsequent cost of debt than their counterparts as the risk of available free cash flows for debtholders increases. Inflation thus only worsens the situation for these groups of corporates. As such, despite a general increase in corporate default spreads, the effect is more pronounced in lower-credit-rated corporates, resulting in a greater divergence across all ratings. (Refer to Exhibit 2)
Exhibit 2: Movement of Corporate Bond Default Spreads in 2022
Corporate Bond Defaults Spreads from AAA to HY (%)
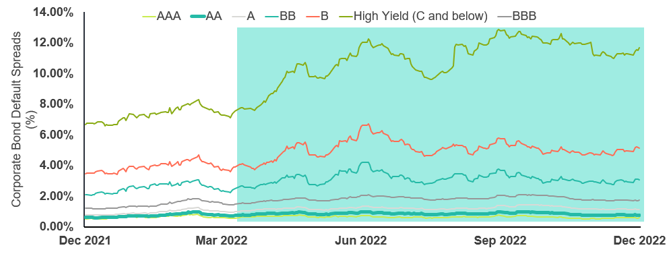
Sources:
(1) Professor Aswath Damodaran’s “Data Update 3 for 2023: Interest Rates and Bond Returns”
Similarly, as persistent inflation continues to drive costs up for more companies, expect to see more corporate downgrades and increased fallen angels. Downgrades increase the risk of the business, resulting in a subsequent increase in default spread and overall cost of debt as well.
1.3 Cost of Equity: Rise in Equity Risk Premiums raises overall cost of equity as well
Inflation has also pushed up equity risk premiums from the lows of 2020. On 1 January 2022, U.S. equities were only priced to earn 5.75% annually, implying an equity risk premium of 4.24% over the risk-free rate at that time. However, a year later, on 1 January 2023, U.S. equities were priced to earn 9.82% annually, representing an implied equity risk premium of 5.94%. (Refer to Exhibit 3)
Exhibit 3: Movement of Equity Risk Premium and Risk-Free Rate
Implied Equity Risk Premium (%), U.S. 10Y Treasury Rate (%)
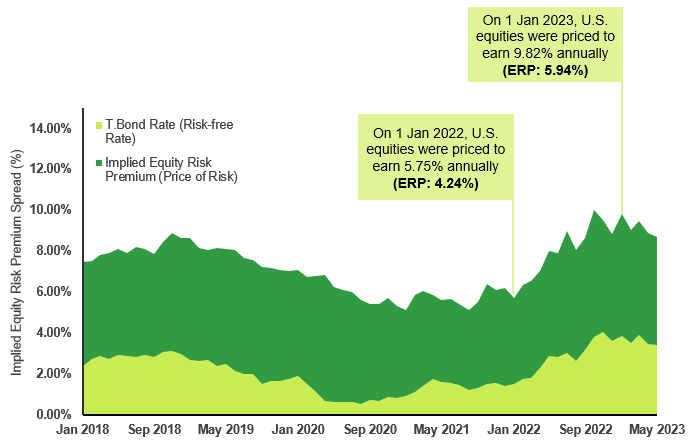
Sources:
(1) Professor Aswath Damodaran’s “Musings on Market – In search of a steady state: Inflation, Interest Rates and Value”
However, despite an increase in equity risk premiums across the board, the overall effect on cost of equity of corporates will be felt differently. Companies with higher risk profiles and greater leverage will be more negatively affected by inflation. At an industry level, businesses operating in riskier industries that are more exposed to market and economic fluctuations will similarly see their cost of equity rise more than their counterparts in less volatile industries. Additionally, companies that operate in hazardous or riskier countries may also see the same effect as others in more stable markets.
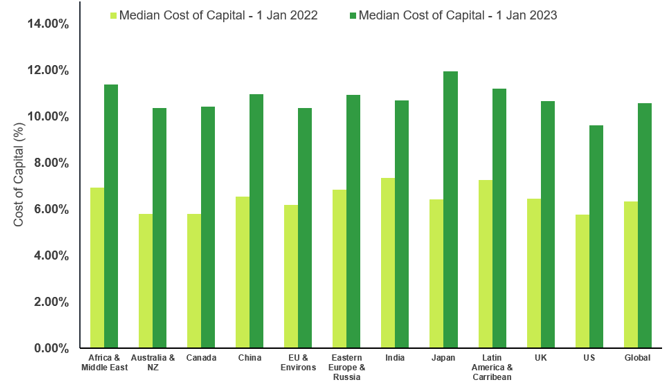
Overall, inflation has undoubtedly raised the cost of capital for all firms across the board. Across 48,000 firms globally, the median cost of capital of companies has risen from 6.33% in 1 January 2022 to 10.6% in 1 January 2023.
2. Effect on Forecasting
2.1 Expected Free Cash Flow: Revenue Growth
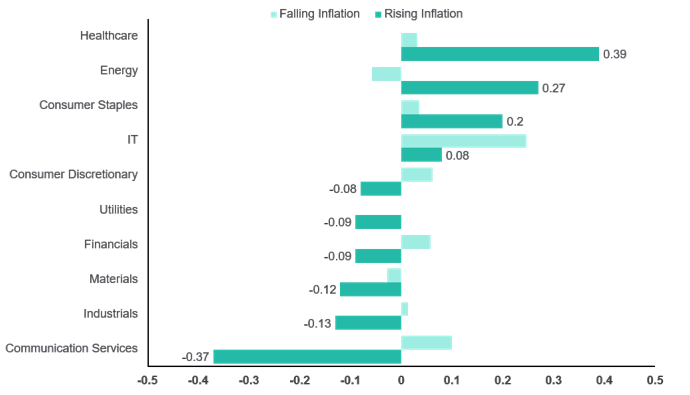
Pricing power is pivotal in acting as a defensive tool for inflation as it gives companies the ability to pass increased costs to consumers without suffering a significant impact on their profit margins and/or earnings. This ability provides greater insulation against inflationary pressures. Typically, companies with strong pricing power, especially in market downturns are characterised by a low standard deviation of quarter-on-quarter (“QoQ”) gross margin change. As seen in Exhibit 4, these sectors are commonly observed in defensive sectors such as healthcare and consumer staples. Consequently, as observed in Exhibit 5, these sectors typically outperform their peers during inflationary periods.
Exhibit 4: Pricing Power of Various Sectors
10Y Quarterly Gross Margin Average (%), Standard Deviation of QoQ Gross Margin Change (%)
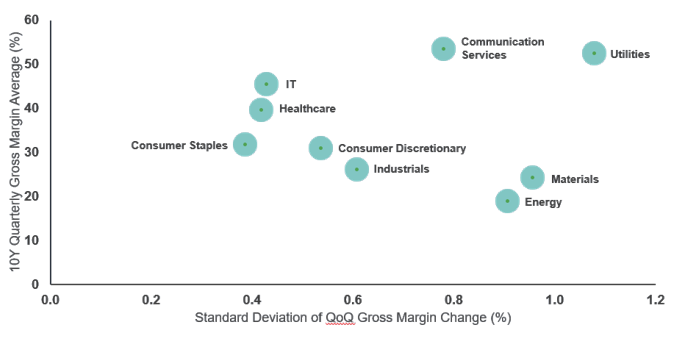
Note:
QoQ refers to “Quarter-on-Quarter”. Refinitiv data points were extracted as of 6 October 2022.
Sources:
(1) Credit Suisse’s Investment Outlook 2023
(2) Refinitiv
Exhibit 5: Active Returns were Contingent on Different Inflation Regimes
MSCI Sector Indexed Monthly Excess Returns over the MSCI World Index from Dec 1975 to Oct 2021
Sources:
(1) MSCI’s “Hotter Inflation Set Some Styles and Sectors on Fire”
To assess a firm’s or industry’s pricing power, we have to consider the (i) market concentration of the industry, and (ii) the discretionary/non-discretionary nature of the product being sold. Market concentration refers to the extent market shares are concentrated among a small number of firms. Sectors with high concentration tend to have greater pricing power since a few dominant firms control the market. While the discretionary/non-discretionary nature of the product or service determines if it is essential or optional for the customer. Products/services with non-discretionary demand, meaning they are essential and have inelastic demand, provide companies with stronger pricing power. As a result of their ability to pass on inflationary costs, these firms are typically able to keep pace with or exceed the rate of inflation.
2.2 Expected Free Cash Flow: Ability to pass on costs is not the only contributor to margin pressure. It is important to consider inherent structure and nature of costs itself as well
Companies that have higher direct costs of production proportionate to their revenues are more negatively affected by inflation than companies with lower costs of production with the former feeling the brunt of rising cost pressures more distinctively. Not being able to pass on these costs will only further magnify the effect on their profit margins. Additionally, companies with inputs that are more exposed to inflation (i.e. commodities, skilled labour) will naturally be more negatively affected by inflation as well.
3. Terminal Value and Other Considerations
3.1 Be Careful in Defining Growth Used in Terminal Value – is the valuation being done in real or nominal terms?
Properly defining the terminal value in valuation is important as it can represent a significant portion of a company’s value. When utilising the perpetuity growth method, there need to be important considerations of assumptions made to arrive at the stable growth rate. From the perspective of inflation, one consideration is to understand the impact of defining real and nominal terms in valuation. In general, if the valuation approach is on a nominal basis, the stable growth rate should be a nominal growth rate that incorporates both real growth and an expected inflation component. If the valuation is to be done on a real basis, then the stable growth rate would be constrained to incorporate only the real growth rate of the company. In this case, the growth rate does not account for the effects of inflation and is typically lower as a result.
Distinguishing between real growth and inflationary growth is imperative in forecasting future cash flows simply from the fact that real growth requires expansionary investment in the business. This means that real growth is driven by the company’s plowing back their earnings into the business at a rate that is beyond what’s needed to maintain the company’s assets in real terms. However, unlike real growth, inflationary growth requires no further cash investment beyond the amount necessary to maintain the company’s assets in real terms. In that sense, if prices throughout the economy are rising at 4%, then in theory, revenues and costs will rise in parallel.
However, as Cornell, Gerger, Jarell, and Canessa (2011) have pointed out in their article titled “Inflation, Investment and Valuation” published in the Journal of Business Valuation and Economic Loss Analysis, what makes growth tricky to deal with in the “real” world, is that it is usually due to a combination of inflation and real growth.
4. What can we say about the overall effect on value?
Nonetheless, understanding the impact of inflation on value comes down to understanding the key drivers of value. Inflation inevitably increases the overall cost of capital for companies as investors demand a higher rate of return to compensate for additional risks associated with a high inflationary environment. (Refer to Exhibit 6) The effect on a company’s free cash flow available to its investors also depends on whether revenues increase at the same rate as the rise in input costs, which highlights the significance of pricing power.
Exhibit 6: Changes in Cost of Capital across the Inflationary Cycle
Median Cost of Capital (%) across distribution of 48,000 firms globally
Sources:
(1) Professor Aswath Damodaran’s “Data Update 3 for 2023: Interest Rates and Bond Returns”
At the end of the day, inflation rate is set to remain sticky in the near term with lessons learnt in the 1970s resulting in more conservative attitudes from the U.S. Federal Reserve in cutting rates too early. The impact of inflation therefore remains a crucial consideration for businesses, investors and auditors alike when pursuing impairment testing of assets. Understanding the implications of inflation on valuation requires a comprehensive assessment of economic factors, market conditions and the specific characteristics of individual companies.